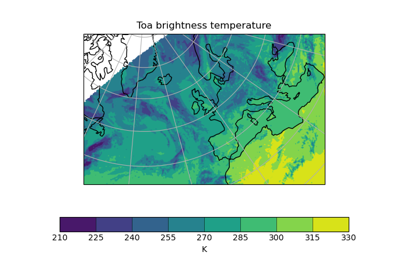
Example of a Polar Stereographic Plot
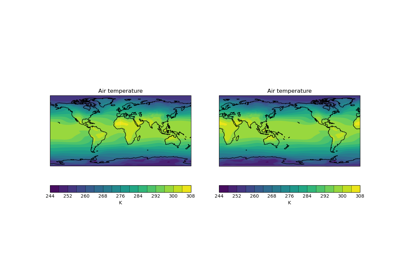
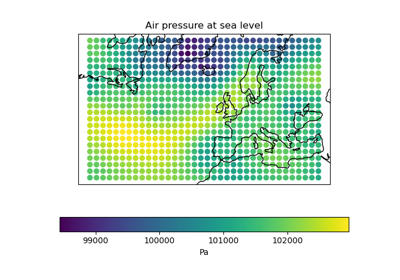
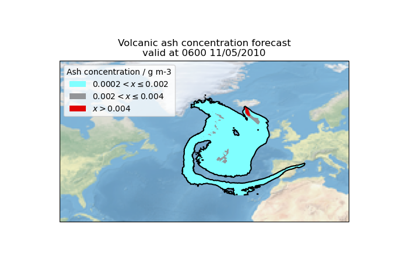
Quickplot of a 2D Cube on a Map
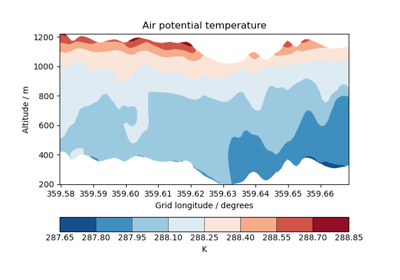
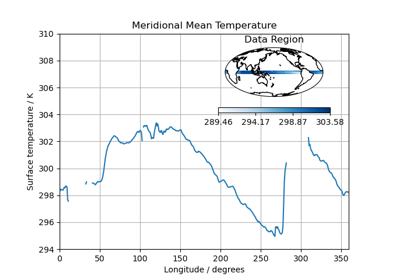
Cross Section Plots
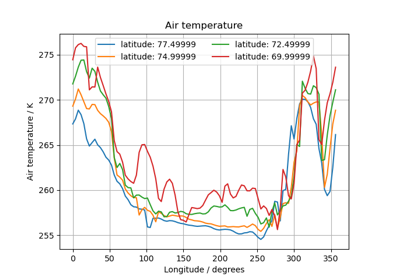
Multi-Line Temperature Profile Plot
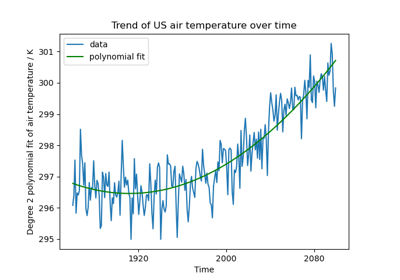
Fitting a Polynomial
Rotated Pole Mapping
Test Data Showing Inset Plots
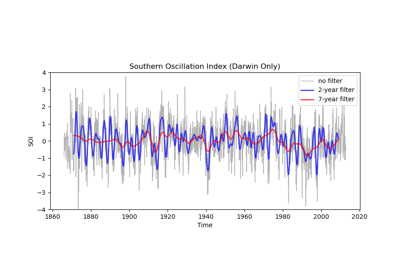
Applying a Filter to a Time-Series
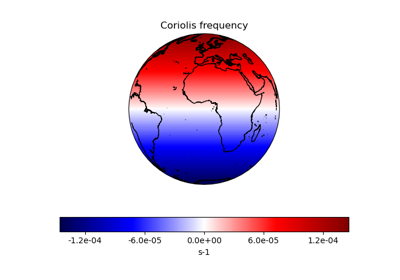
Deriving the Coriolis Frequency Over the Globe
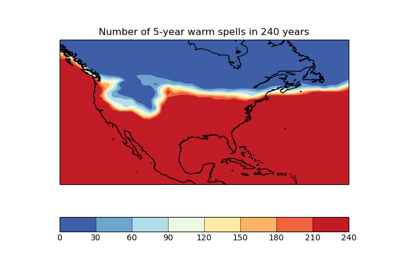
Calculating a Custom Statistic
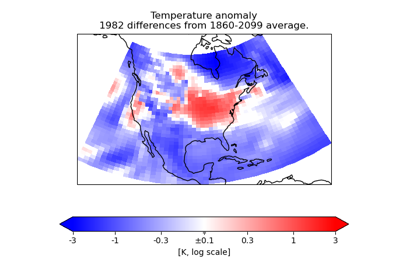
Colouring Anomaly Data With Logarithmic Scaling
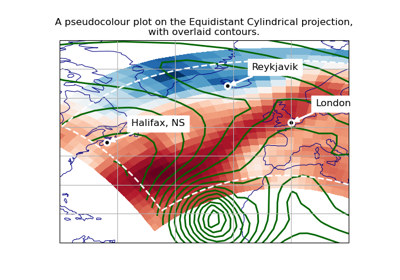
Plotting in Different Projections
Loading a Cube From a Custom File Format
previous
Gallery
next