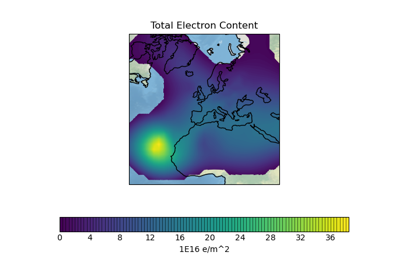
Ionosphere Space Weather
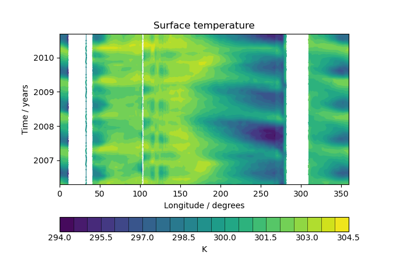
Hovmoller Diagram of Monthly Surface Temperature
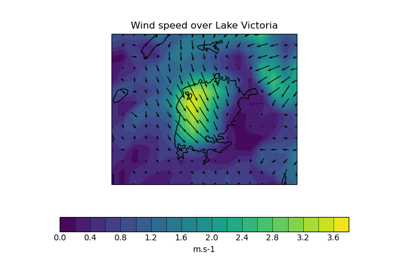
Plotting Wind Direction Using Quiver
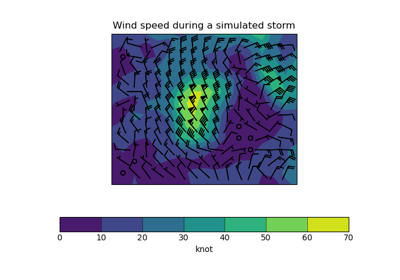
Plotting Wind Direction Using Barbs
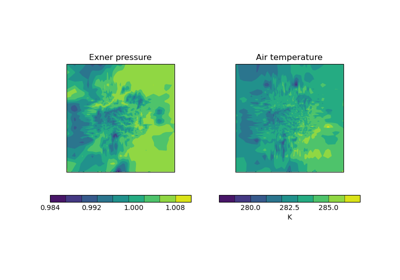
Deriving Exner Pressure and Air Temperature
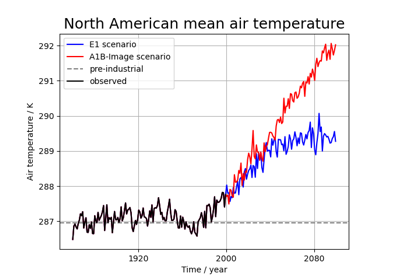
Global Average Annual Temperature Plot
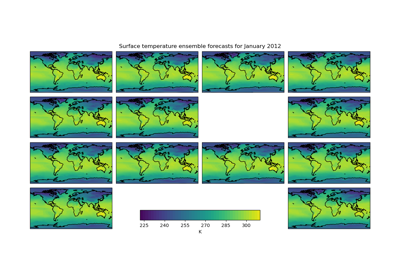
Seasonal Ensemble Model Plots
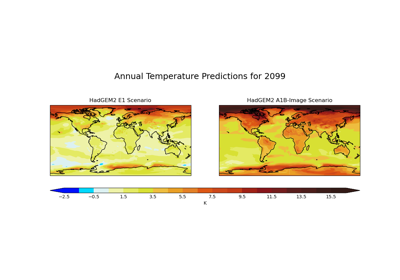
Global Average Annual Temperature Maps
previous
Loading a Cube From a Custom File Format
next